Visualize your IT infrastructure as a 3D virtual city
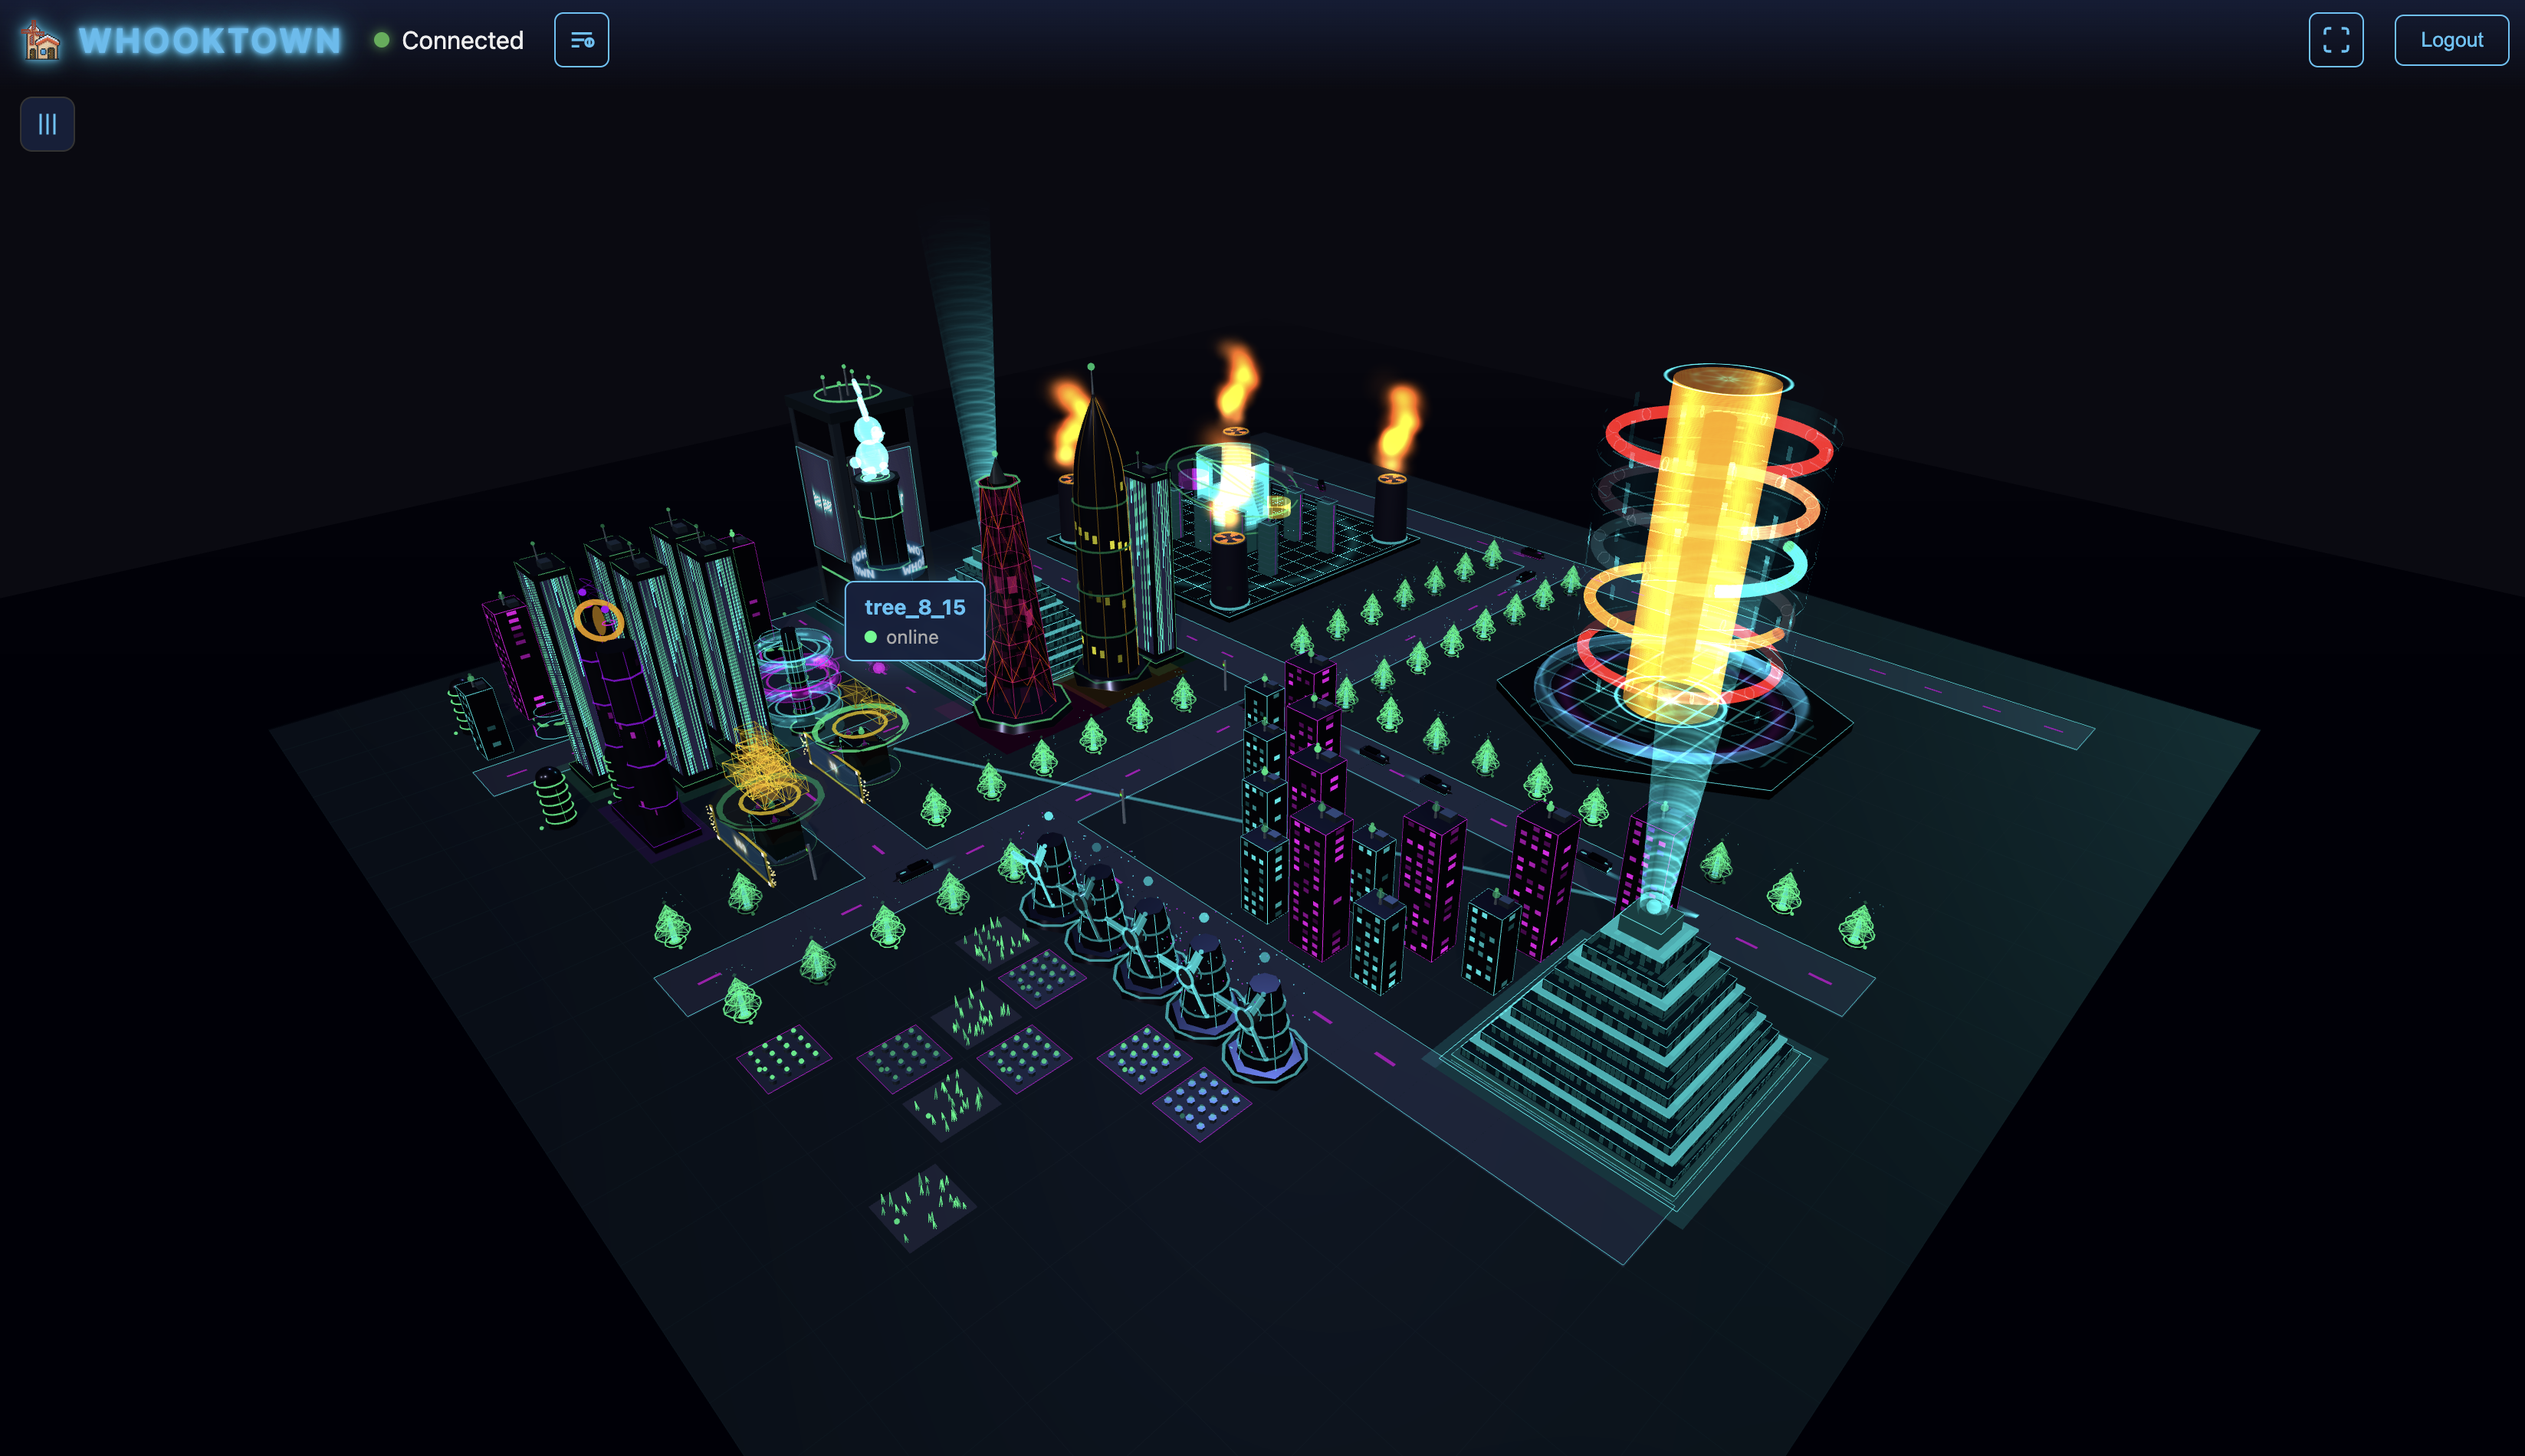
Transform monitoring data into an immersive cyberpunk experience. Watch your servers come alive as buildings in a neon-lit metropolis.
Why WhookTown?
Transform boring dashboards into an immersive monitoring experience
Real-time Visualization
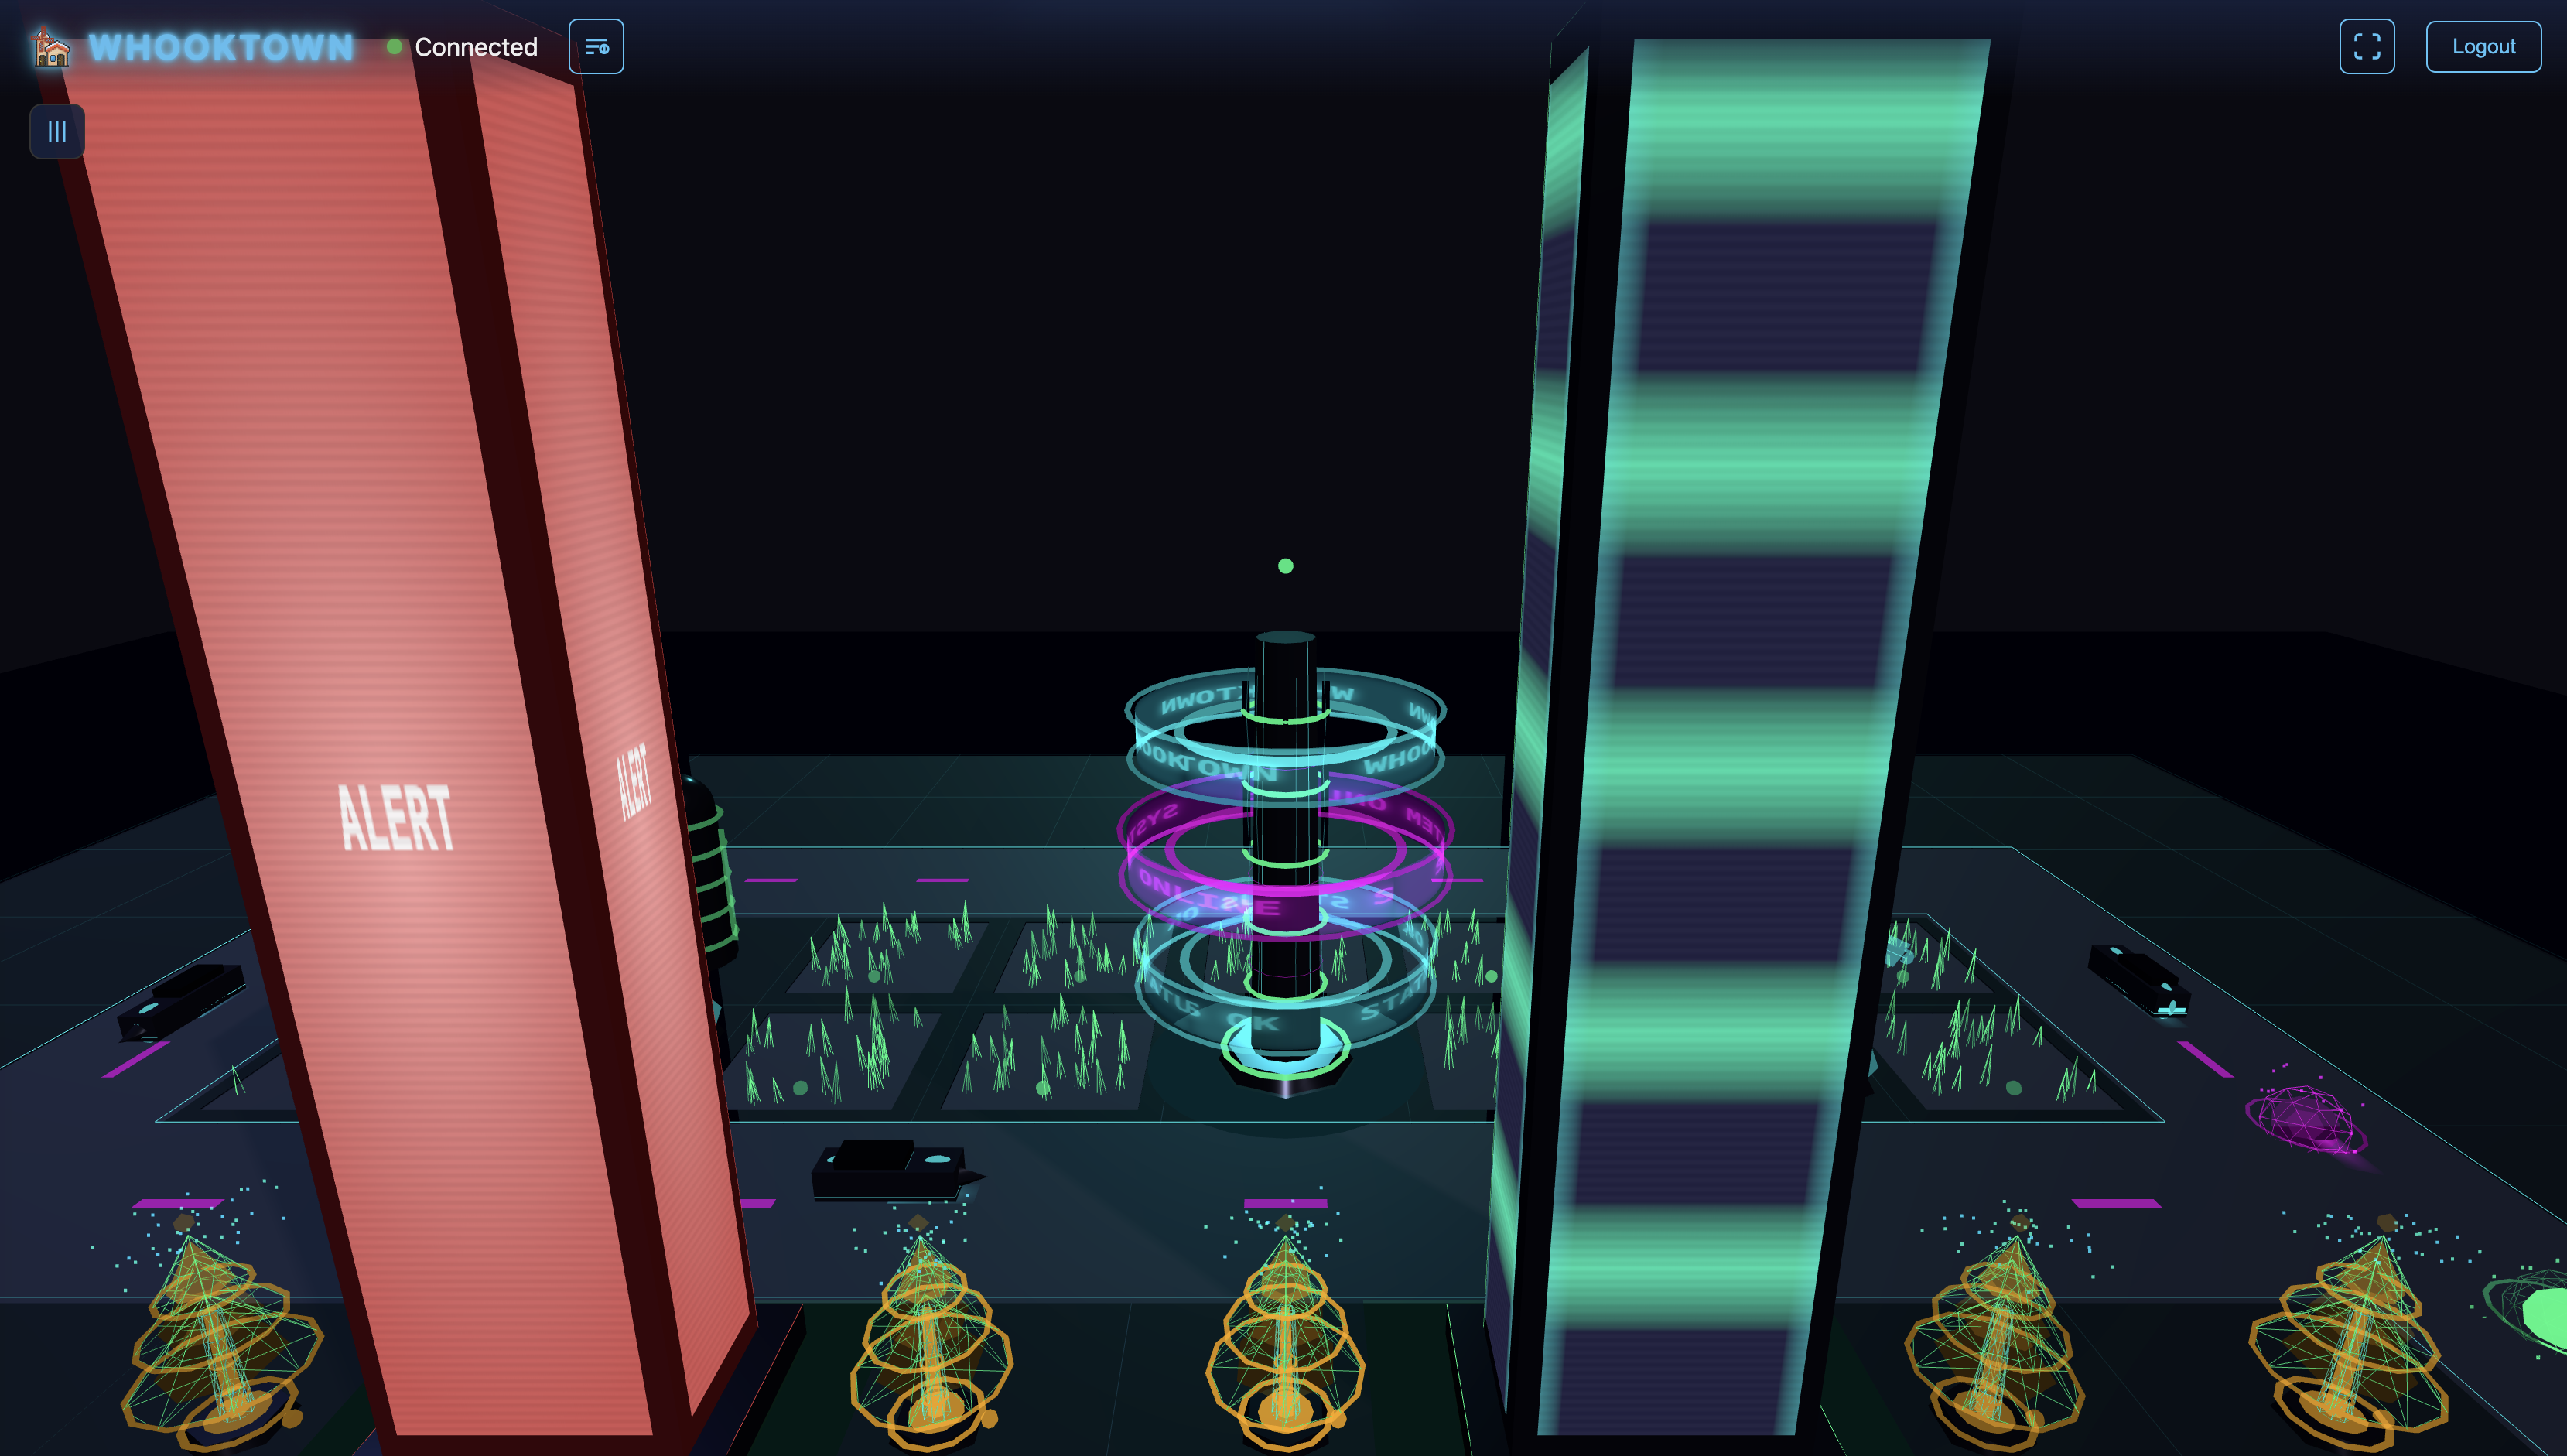
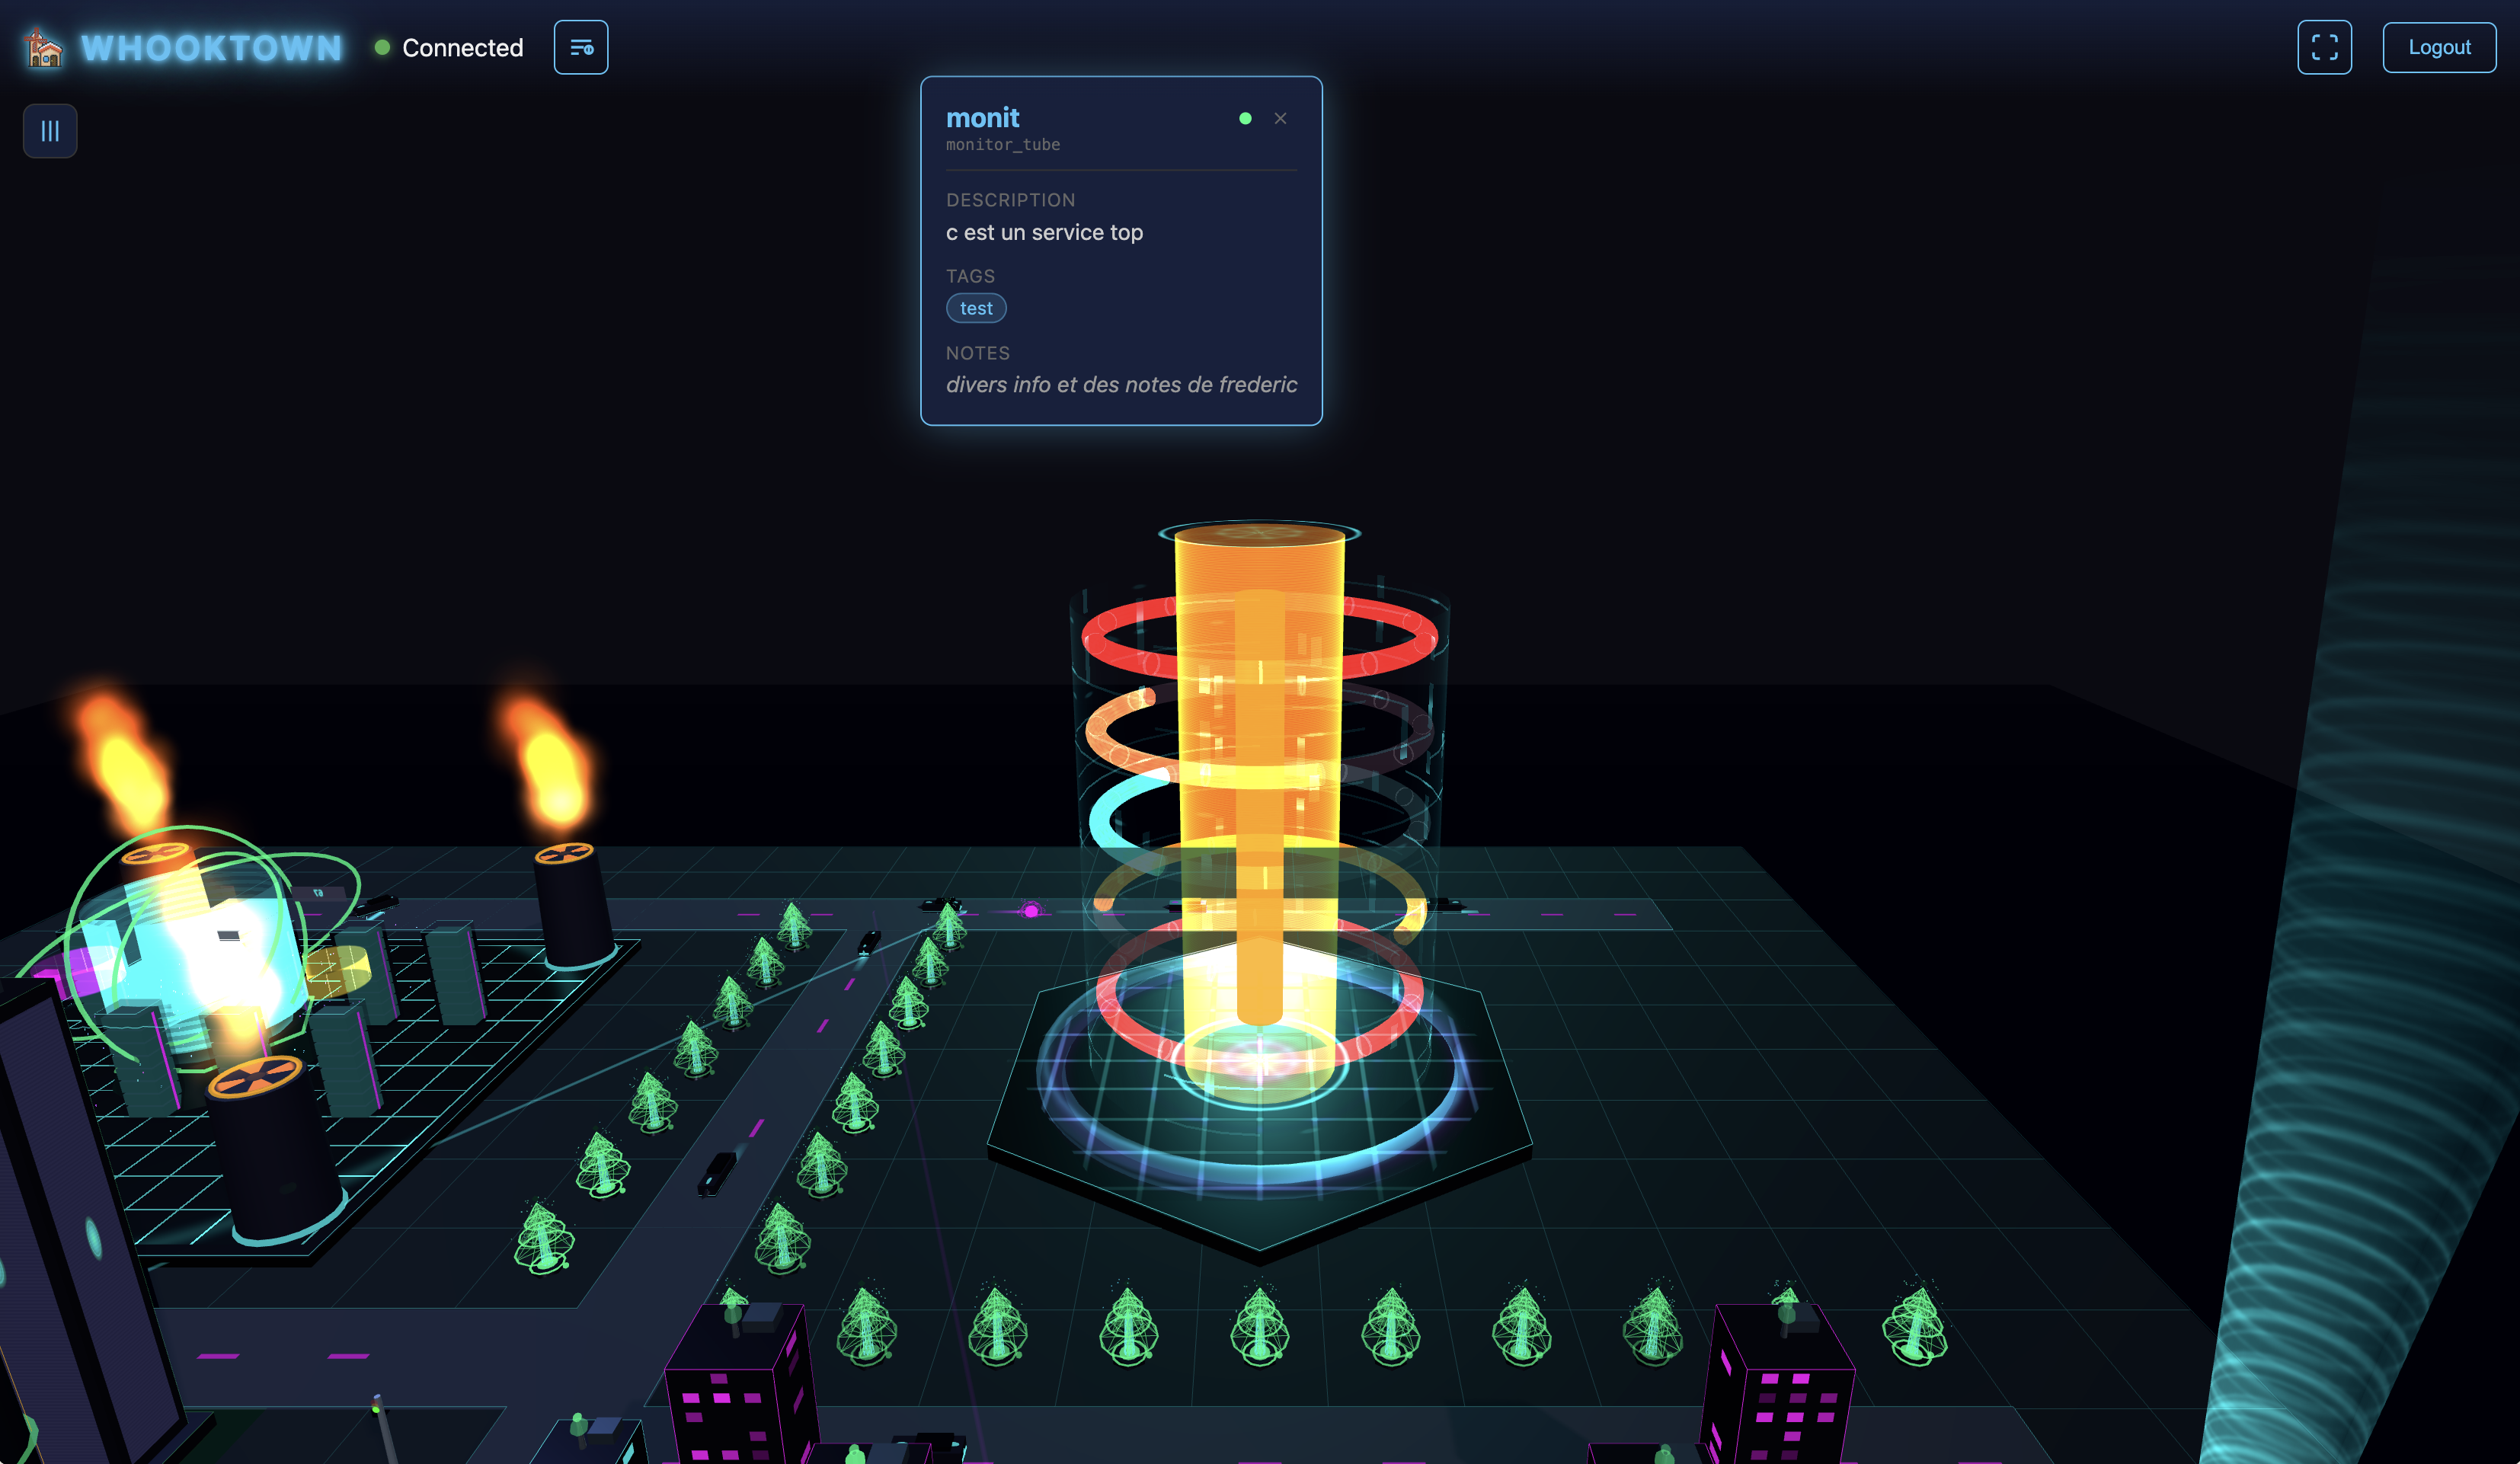
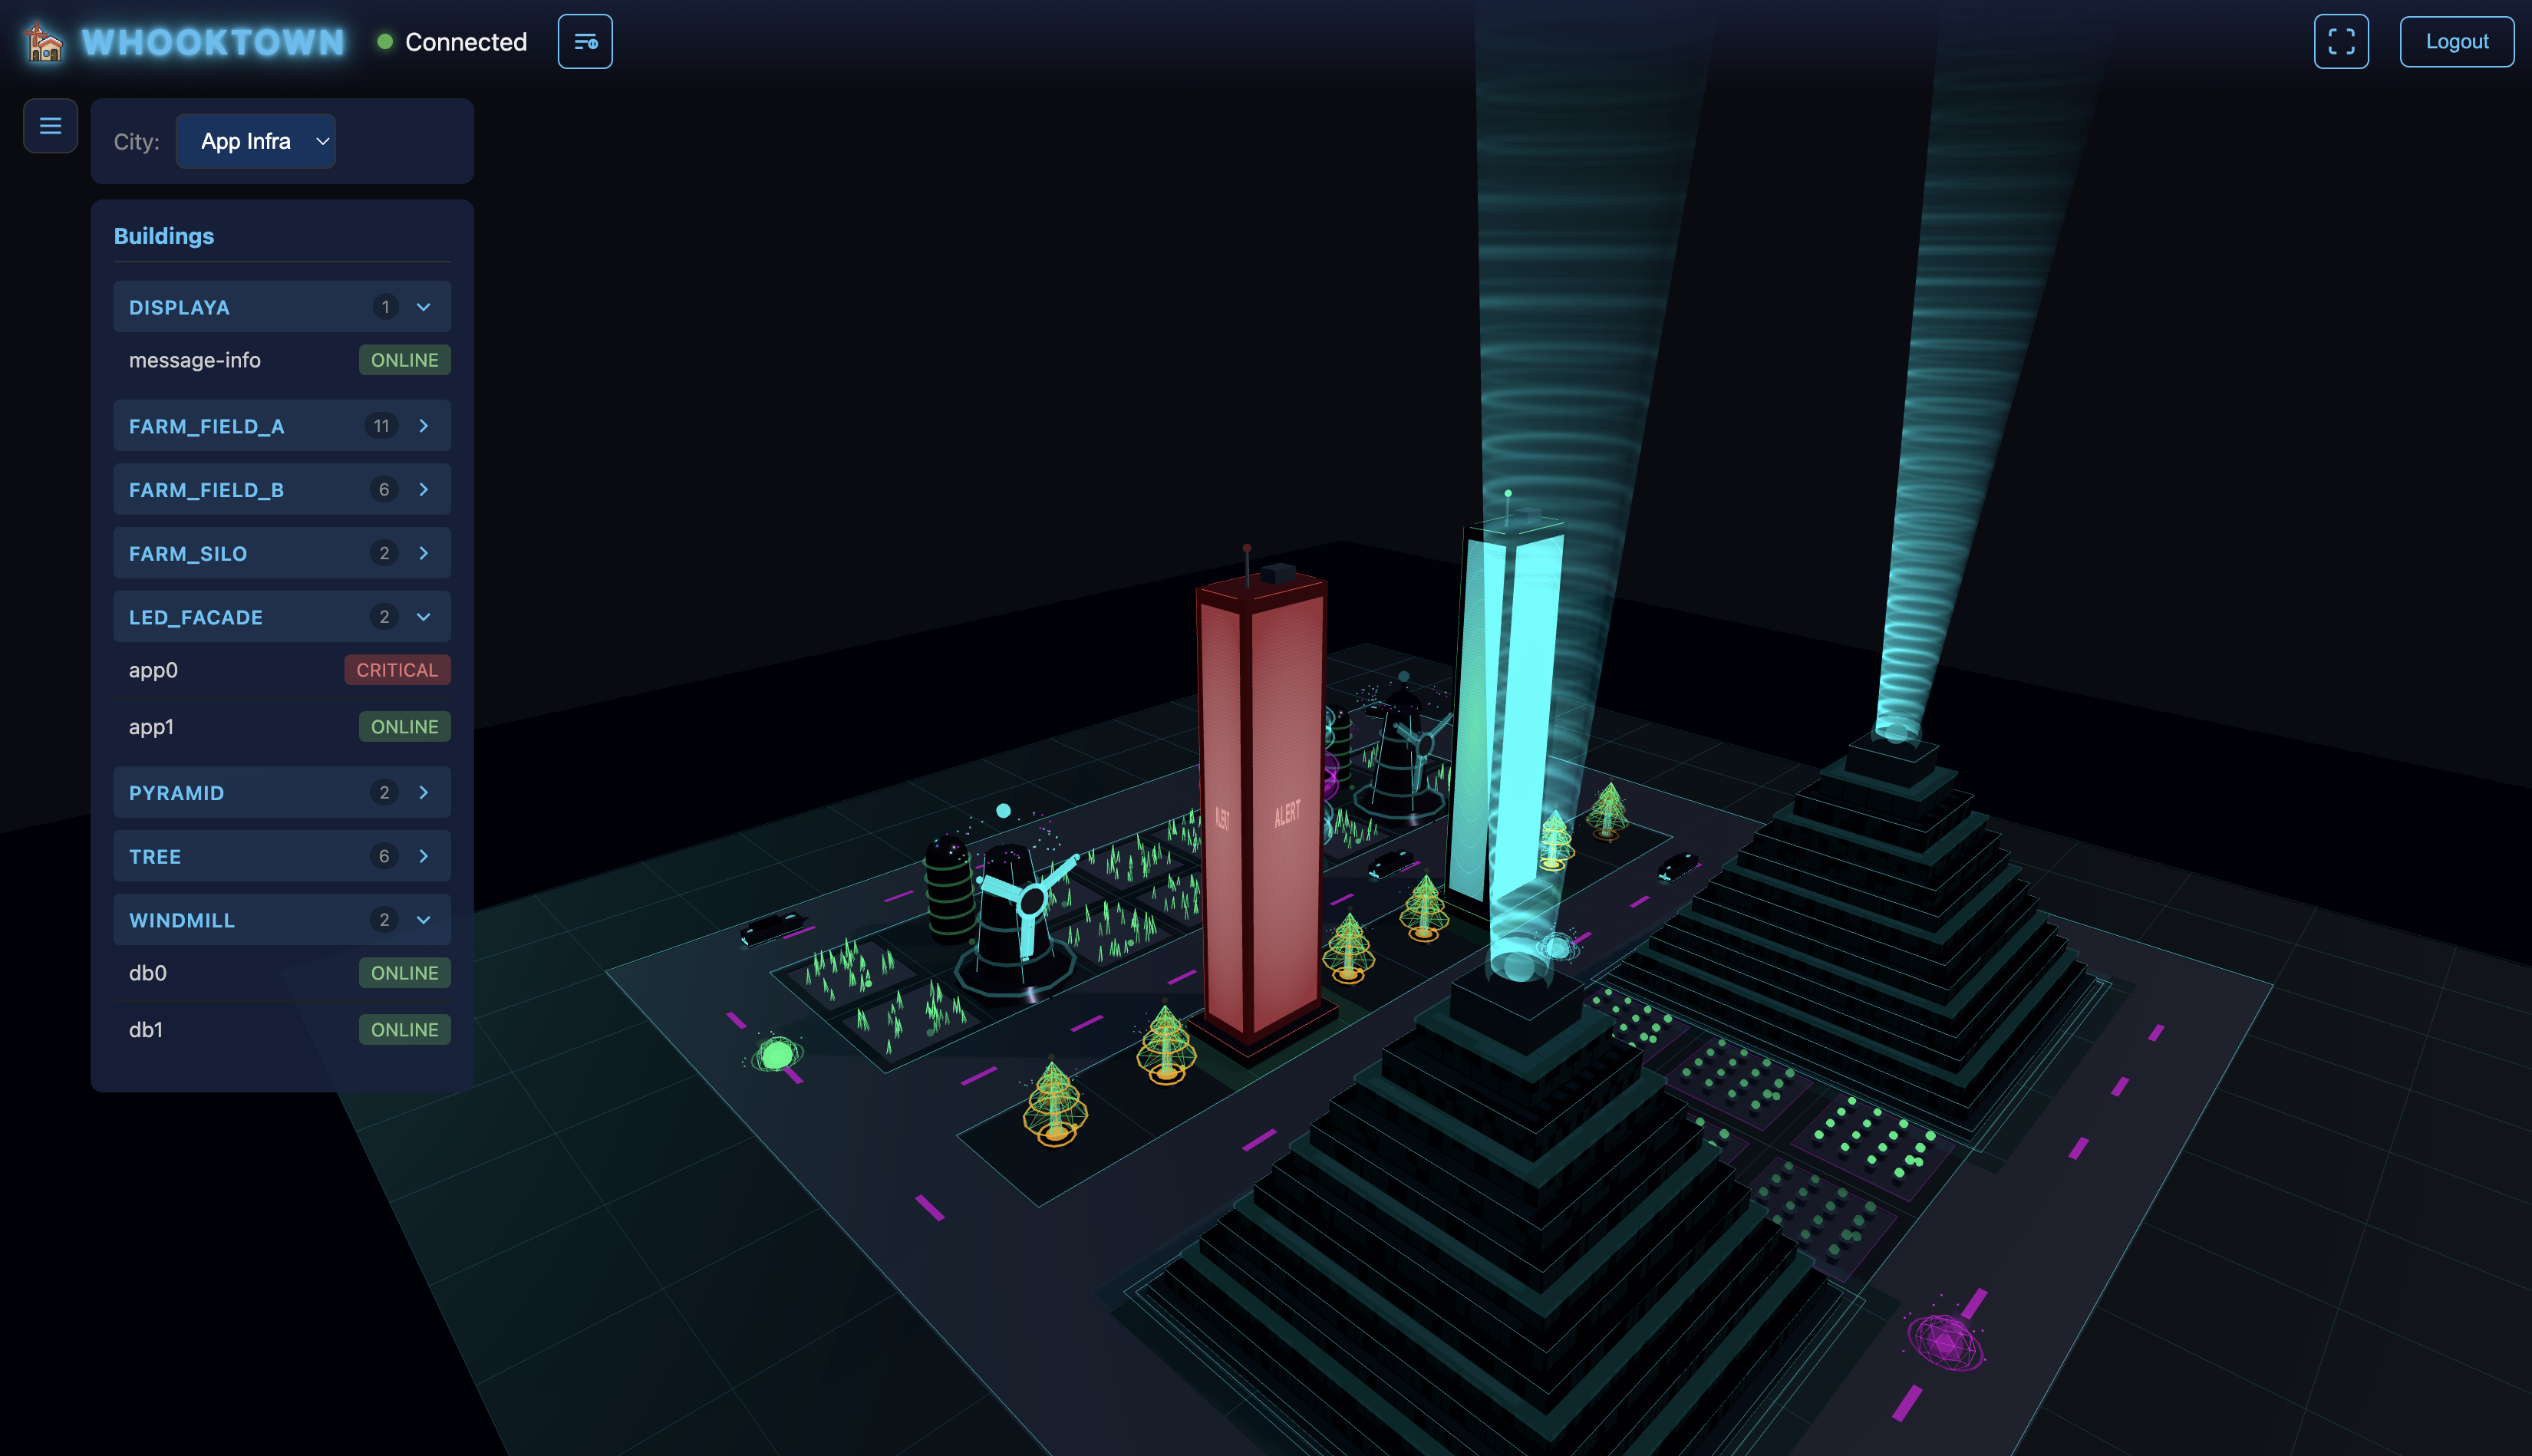
Buildings instantly reflect your server status. See problems at a glance with color-coded states: green for healthy, orange for warnings, red for critical.
23+ Building Types
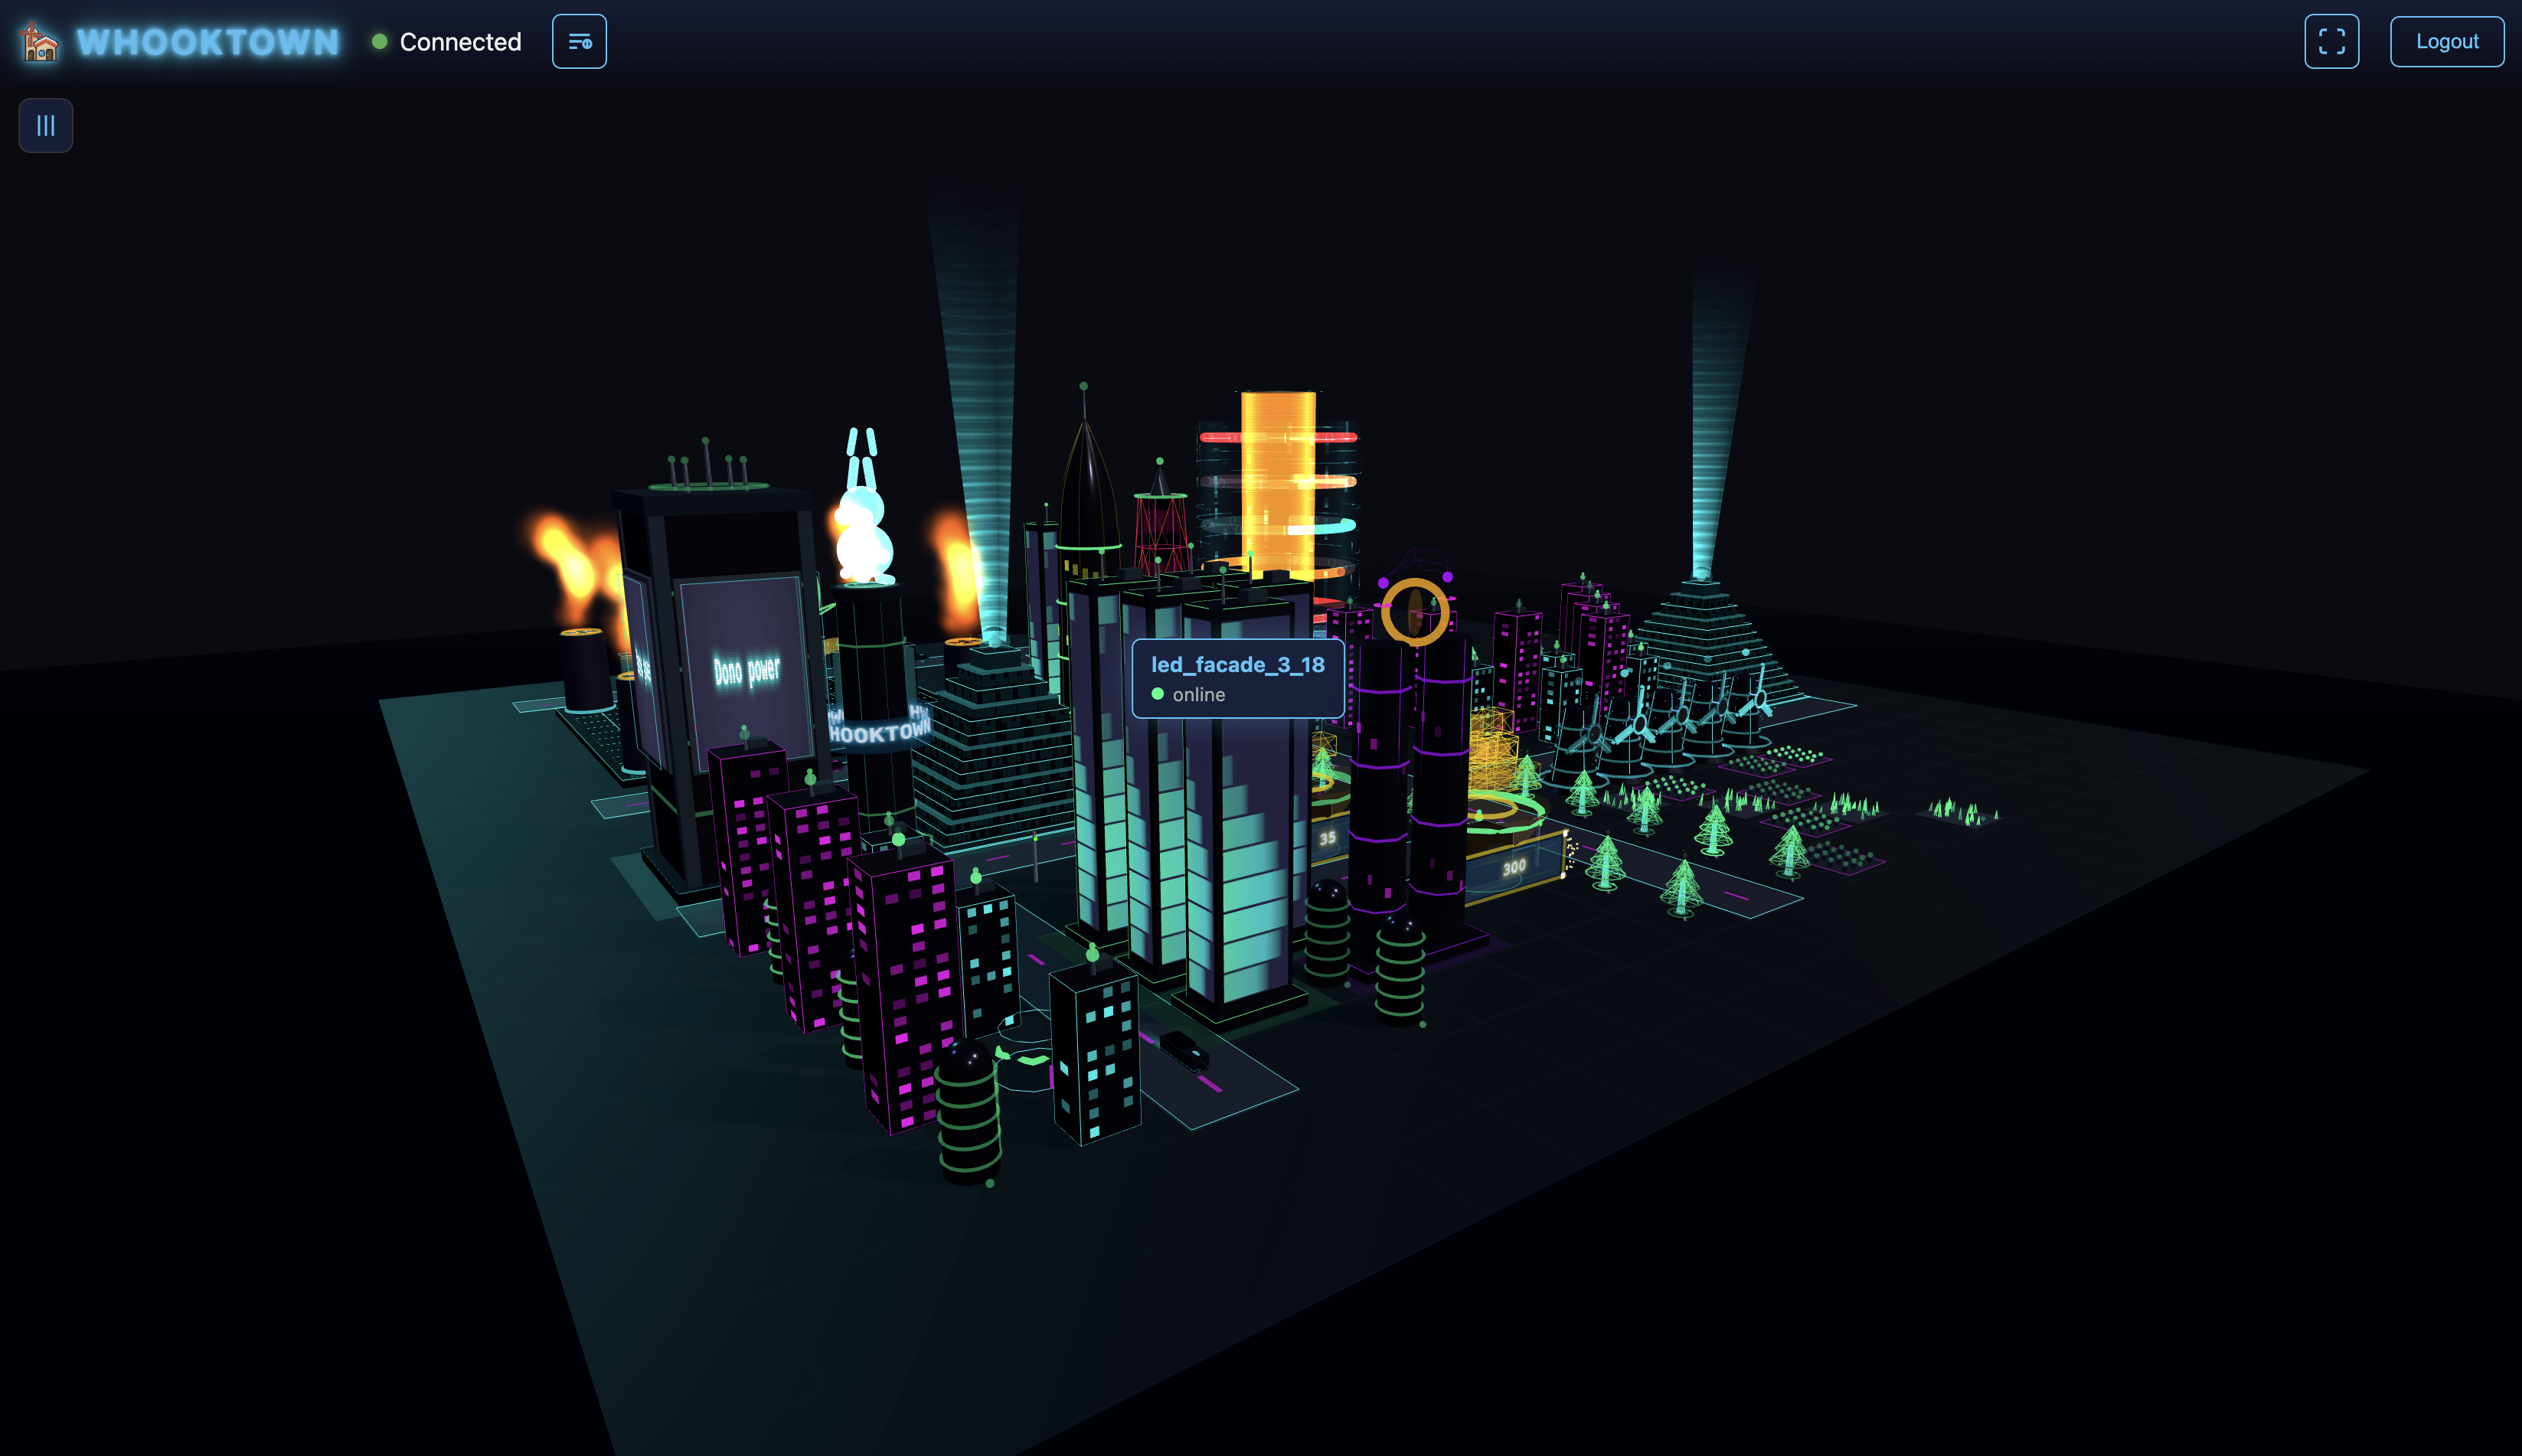
Windmills, data centers, pyramids, towers, arcades... Each building type has unique animations and visual effects to represent different services.
Workflow Automation
Visual node editor to create automated workflows. Trigger actions based on sensor data, transform inputs, and control your city's behavior.
Your City Awaits
Explore the neon-lit streets of your virtual infrastructure
Ready to build your virtual city?
Start visualizing your infrastructure today. Free tier available.